Natural Hazards

Case Study

Assessing Extreme Fire Risk In California

New Maps to Address New Threats

Spatial Informatics Group undertook a massive data parsing and fire simulation effort in order to identify places throughout California at elevated and extreme fire risk

Utility and Communications Infrastructure was Starting Wildfires

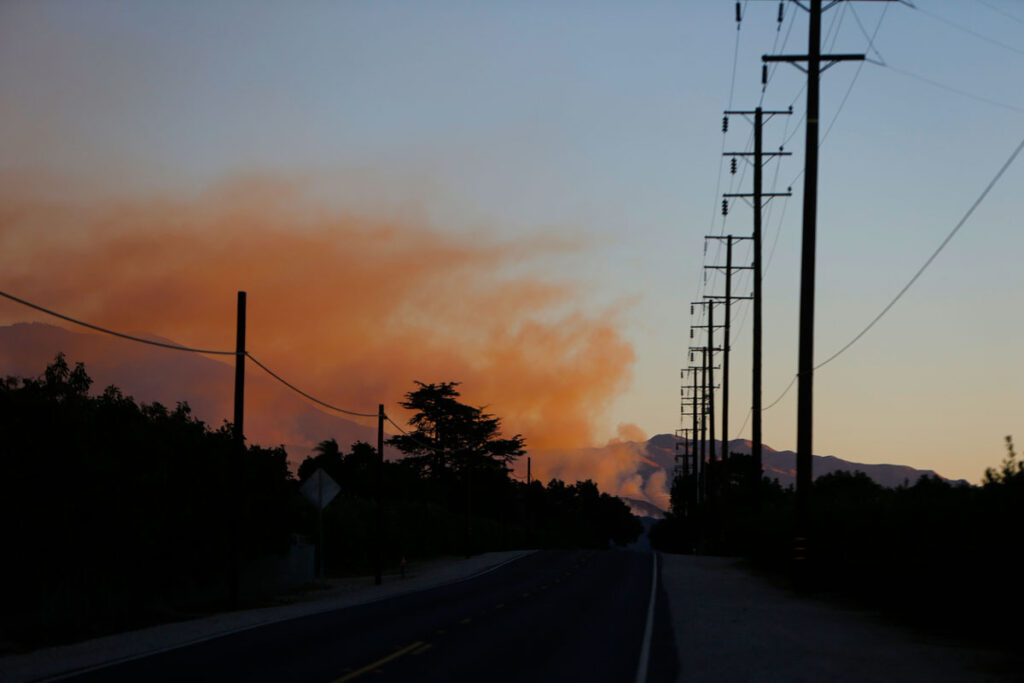
In October 2007, wildfires burned hundreds of square miles in Southern California, many of them ignited by overhead utility power lines and aerial communication facilities near power lines downed by powerful Santa Ana winds. In response to these wildfires, the California Public Utilities Commission (CPUC) began to consider and adopt regulations to protect the public from fires associated with power lines and communication facilities.

Inadequate Geospatial Awareness

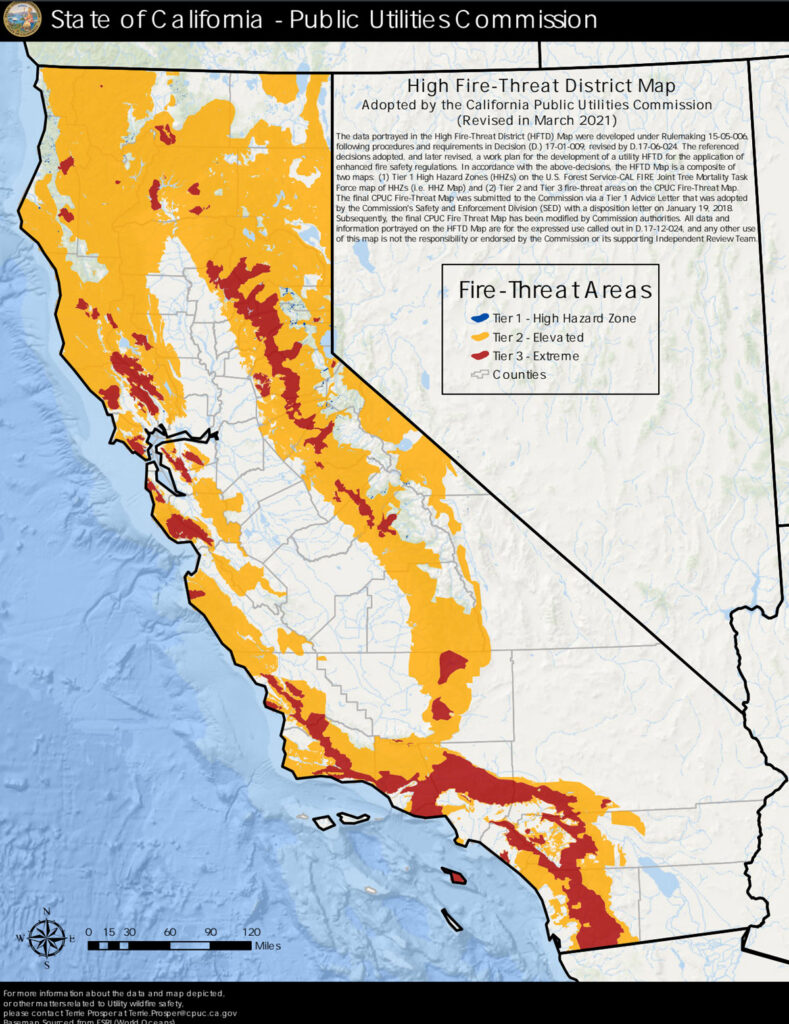
However, the available utility-specific fire threat maps did not provide comprehensive statewide coverage. So CPUC, through CAL FIRE, hired Spatial Informatics Group to create a new statewide fire threat map incorporating new legislative imperatives and specifically addressing new fire safety regulations for electric utilities and communication structures.
Wildfire Simulations
High Fire-Threat District Map

Detailed Wildfire Simulations

SIG scientists worked with CAL FIRE and the Desert Research Institute. We used the Weather Research and Forecasting (WRF) Model, a mesoscale numerical weather prediction system designed for both atmospheric research and operational forecasting, inputting a decade of hourly, 2km gridded weather data for all of California.

From this enormous dataset, SIG scientists extracted the worst two percent of fire weather conditions for each grid cell. We then performed 1000 unique, high resolution wildfire simulations per cell using SIG’s GridFire wildfire behavior model, based on fuels and vegetation data input from the LANDFIRE 1.3 dataset. Ultimately we simulated over 100 million ignition events around the state of California under historical extreme weather conditions.

New Maps Help Planners Understand Fire Risk

We aggregated the results to create numerous fire risk distribution maps based on urban development, fuels, vegetation, topography, weather and existing electrical infrastructure. These maps are helping planners understand where the greatest fire risk is found in California. CPUC is employing these maps to determine which utilities are most at risk, allowing them to plan and implement actions that will reduce the likelihood and impacts of utility fires.

See the CPUC Fire Threat Maps